The US government is working on building a climate resilience portal that seeks to bring together all valuable information on climate change and its impacts under one umbrella. David J. Hayes, Special Assistant to the US President for Climate Policy, revealed this at Esri User Conference 2022 underway at San Diego.
“Much of which already exists in various websites, many of them on different federal agencies, websites. But which can be hard to find and put together. But because climate change is impacting [everything] in such a dynamic way, we need to not only know what’s happening now, but we need to project into the future. And that’s one of the most exciting things about a potential portal,” he said as part of his keynote address.
The portal will not only host the data — both, the information that’s happening now and happened in the past — but also combine it with the advanced modeling tools to project different scenarios for government agencies, businesses and even communities to plan ahead. The government is collaborating with Esri for this project.
“It’s not easy to put such a portal together. Nor as a general matter is it easy for the federal government or state or local governments to take on climate change. Because, as you know, there is no federal or State Department of Climate or Department of Climate Resilience!”
Hayes’s address focused mainly on President Joe Biden’s ambitious climate agenda and how geospatial and mapping tools are integral part of addressing those issues.
Because how overarching the impact of climate change has become in every sphere, Hayes explained that addressing the issue today is every agency’s mission, and there is a whole-of-government approach to climate.
“It’s why the President established the White House Climate Office in which I sit and the cabinet-level National Climate Task Force that we work through. And it’s why we have formed a half dozen impact-specific interagency working groups to develop cross-agency strategies to address the drought, the extreme heat, the floods, which care not for agency jurisdictional boundaries. And it’s why the President has unleashed the power of the White House and so many of my fellow feds are here today from USGS from NOAA, EPA, HHS, DOD, NASA, and so many other agencies that use GIS tools with guidance from the Federal Geographic Data Committee,” he said.
The Task Force is now responsible to follow climate data and tie it to geography and provide mapping tools that would help all Americans in all communities respond to and fight climate change. “And that’s why so many of you in state and local governments, and in large and small businesses, and non-profits, are equally passionate about being here today. And why you are so central in creating GIS mapping tools that will help us meet the challenge posed by climate change.”
ALSO READ: The Fight Against Climate Change From Space
Three core actions, and two imperatives
Hayes underlined three core actions as part of the agenda – one, reduce greenhouse gas emissions that are causing climate change; second, accelerate the transition to a clean energy economy; and third, make communities more resilient and adaptive to climate change. He also highlighted two cross-cutting imperatives — engaging with the entire global community and advancing equity by coming up with climate solutions that acknowledge that disadvantaged communities have borne the brunt of historical environmental injustice and now are being disproportionately hurt by climate change.
“And geospatial mapping tools may be the most important weapon that we have to fight against climate change,” he stressed.
Reducing emissions
“Take methane gas emissions from oil and gas operations. These emissions are not visible to the naked eye, but thanks to new technology, it’s now possible to identify, trap, track, map and stock destructive methane emissions,” he said, while giving the example od Carbon Mapper, the non-profit engaged in data collection and geospatial mapping efforts to locate and track methane and CO2 emissions from air and space.
“We know that our trees, our grasslands, and our wetlands, capture and take up and sequester CO2, removing it from the atmosphere and in effect, helping us achieve net reductions in greenhouse gas emissions. And restoring our forest and wetlands can help take a big step in reducing CO2 from the atmosphere. So, is it possible to see these carbon gains and losses on our landscapes? Yes, through maps,” he said, while highlighting use of satellite imagery, particularly the Landsat program, in monitoring changes on Earth.
The Landsat series, which just completed 50 years this June, has been vividly documenting land cover changes on Earth over time, and the program got a boost last year with the successful launch of Landsat 9.
Hayes revealed that it was this connection between conservation and climate that prompted President Biden in his Climate Executive Order to establish the goal of conserving 30 per cent of the land mass and 30 per cent of our oceans to help combat climate change. Called America the Beautiful, initiative is a Department of the Interior project that seeks to restore, connect and conserve 30 percent of lands and waters in the country by 2030.
ALSO READ: We Need to Scale Up Action to Meet the 1.5 C Target – Interview with WMO chief
“But the President’s goal of conserving 30 percent of our land mass extends beyond protected lands to cover working lands as well. That farmers, ranchers and foresters are managing in a responsible way to conserve carbon and provide other benefits,” he said, adding that the USGS now has a new task to create an American Conservation and Stewardship Atlas that will extend beyond protected lands and start tracking conserved, working lands too.
“Once again, we are looking for common ground that many people can get behind. We need to see it, to feel it, and to find it on a map,” he said.
Transition to a clean energy economy
Smart maps are needed here too. “We need to know the strength of the offshore wind resource off the Atlantic coast in the United States, so we can put offshore wind turbines in the optimal location,” Hayes said.
There was also a need to be smart about avoiding conflicts as we lease those offshore waters, he said while pointing to a set of cadastral maps by NOAA of best places to lease. A successful case was when the land off of the New York and New Jersey shore that had been deconflicted was leased off for USD 4.3 billion.

“This is a new industry that’s taking off. It’s getting a good start because of good mapping,” he said, adding that likewise, for the solar projects being built in the Mohave Desert, the Renewable Energy Conservation Plan relied on maps to find the best areas.
“We need tens of thousands of new miles of transmission lines in the United States to unlock renewable energy resources we have in the great Plains and in the arid mountain west. How do we find the best place to put those lines? Again, maps,” he said.
Hayes also underlined the value of geospatial mapping for setting up charging stations to roll out the National Electric Vehicle Infrastructure (NEVI) Formula Program. “Congress has given us more than $10 billion to put in new charging stations. Where should they go? We need the help of transportation experts, driving experience experts, and maps to get there,” he said.
The NEVI formula program established by the Bipartisan Infrastructure Law, provides for funding to designated EV Alternative Fuel Corridors to serve as the backbone for the national electric vehicle charging network. With 249 new designations, corridors now cover 85% of the National Highway System.
Last week, the Department of Transportation also announced a set of measures to help states and municipalities to track and reduce greenhouse gas (GHG) emissions. The new rule seeks to establish a national framework to track state-by-state progress by adding a new GHG performance management measure to the existing national performance measures of the Federal Highway Administration to help states track performance and make more informed investment decisions.
Climate resilience
Communities need to be made more resilient and adapted to the climate impacts they are already are facing. The past few years have seen rise in extreme weather events — massive floods, extreme heat waves, severe coastal erosion — which experts are directly attributing to climate change.
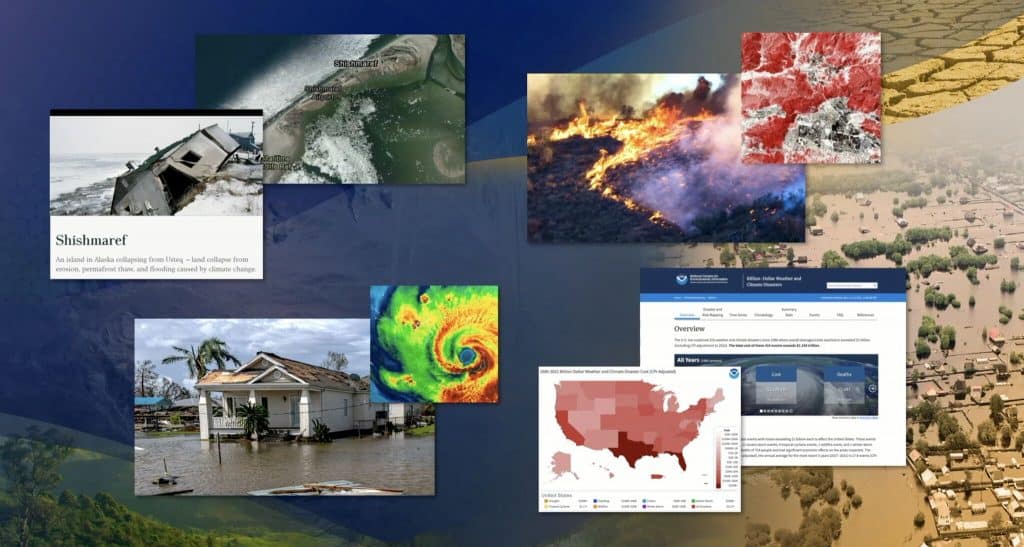
During 2021, there were 20 separate billion-dollar weather and climate disaster events across the United States. The total cost from these events of 2021 was USD 152.6 billion, which is the third most costly year on record, behind 2017 and 2005. According to NOAA, the total costs for the last five complete years (USD 788.4 billion) is more than one-third of the disaster cost total of the last 43-years (1980-2022), which exceeds USD 2.275 trillion.
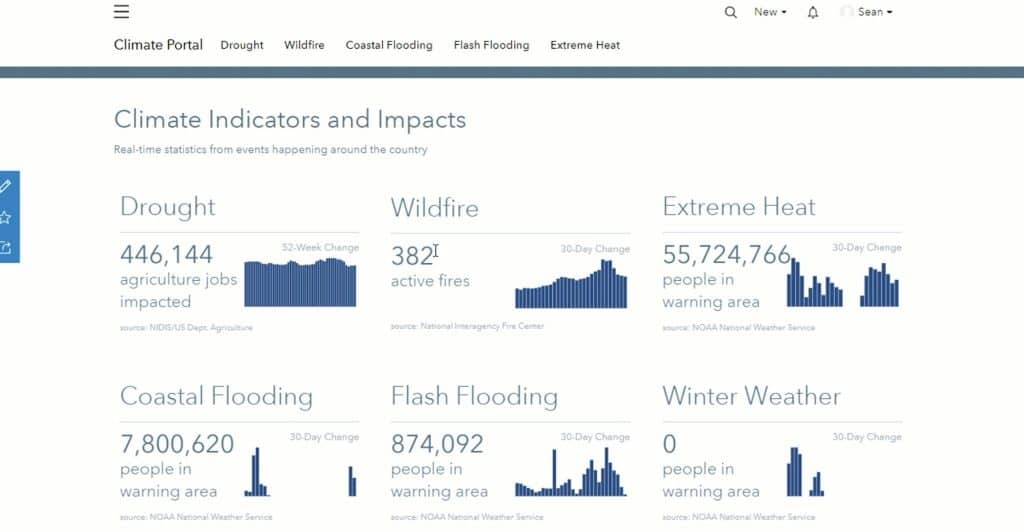
“Helping Americans cope with these climate impacts that are hitting us in the here and now may present the greatest near-term challenge for us. These climate impacts are taking lives and livelihoods from Americans every day and others throughout the world,” Hayes said, while handing over the stage briefly to Sean Breyer, Manager of Esri’s Living Atlas, to provide a quick walkthrough of how sophisticated GIS mapping gathered together in a broadly accessible climate resilience portal could give citizens vastly more information about the threats their homes and businesses face now and projected into the future, to floods, wildfires, coastal impacts, drought and extreme heat.
for energy and also impact human activities.
This map is extreme precipitation allows us to look at areas that are expected to see increased rainfall over shorter durations of time that could lead to flooding
Justice for disadvantaged communities
In his Climate Executive Order, President Biden established the Justice40 Initiative, which seeks to ensure that ensure that federal agencies work with states and local communities to deliver at least 40 percent of the overall benefits from federal investments in climate and clean energy to disadvantaged communities.
“So how do we identify and locate the disadvantaged communities and check on where the benefits are flowing?” Hayes asked. The answer is obvious — smart geospatial maps.
The White House’s Council for Environmental Quality has put together a climate and economic justice screening tool that identifies disadvantaged communities as tested across multiple criteria. Including climate impacts, access to clean energy, clean transit, affordable housing, clean exposure et al. The project is in data testing currently, and Esri has put it on its platform the seven criteria data layers that are used in the screening tool to facilitate its use.
“The stakes here for climate couldn’t be higher. One measure is the economics with those extreme weather events of last year — those USD 145 billion. They only tell part of the story — the human suffering is disheartening. But we do have the funding and we need to spend our money in a smart way,” Hayes said, adding that for every dollar of spending that is put on the front end – the preparedness — USD 10-11 are saved on post disaster planning.
As part of the Bipartisan Infrastructure Law, USD 50 billion has been allotted for climate resilience.
Hayes ended his talk by reiterating that good information is integral to do the right planning in the right way and in the right place. And that’s where geospatial mapping comes in.
“So, let’s spend this money wisely at the local level where one size does not fit all. Where disadvantaged communities in particular have to be paid attention to. So, all of you, fellow believers in the power of mapping, let’s raise our game. Let’s show where the common ground is and let’s beat climate change.”